
«... Oil is falling. — This is okay, soon enough the snow will start falling too;)». It was just the dialogue that we ended our editorial office yesterday with and went home with a smile. The oil market...
«... Oil is falling. — This is okay, soon enough the snow will start falling too;)».
It was just the dialogue that we ended our editorial office yesterday with and went home with a smile. The oil market is an exciting thing, but let’s take a look at the charts of the top coin in the cryptocurrency market.
Hourly chart
As we wrote in the latest review, on November 12, the Bitcoin was trading on the support line at $ 6,440. November 13, the price dropped to the level of $ 6,400, but quickly returned above the support level of $ 6,440. Now the price is moving in an upward wedge (see the chart). Moving averages are located below the price. EMA50 is at the level of $ 6,455, and it acts as a local level of support. MACD indicator in the buy area.

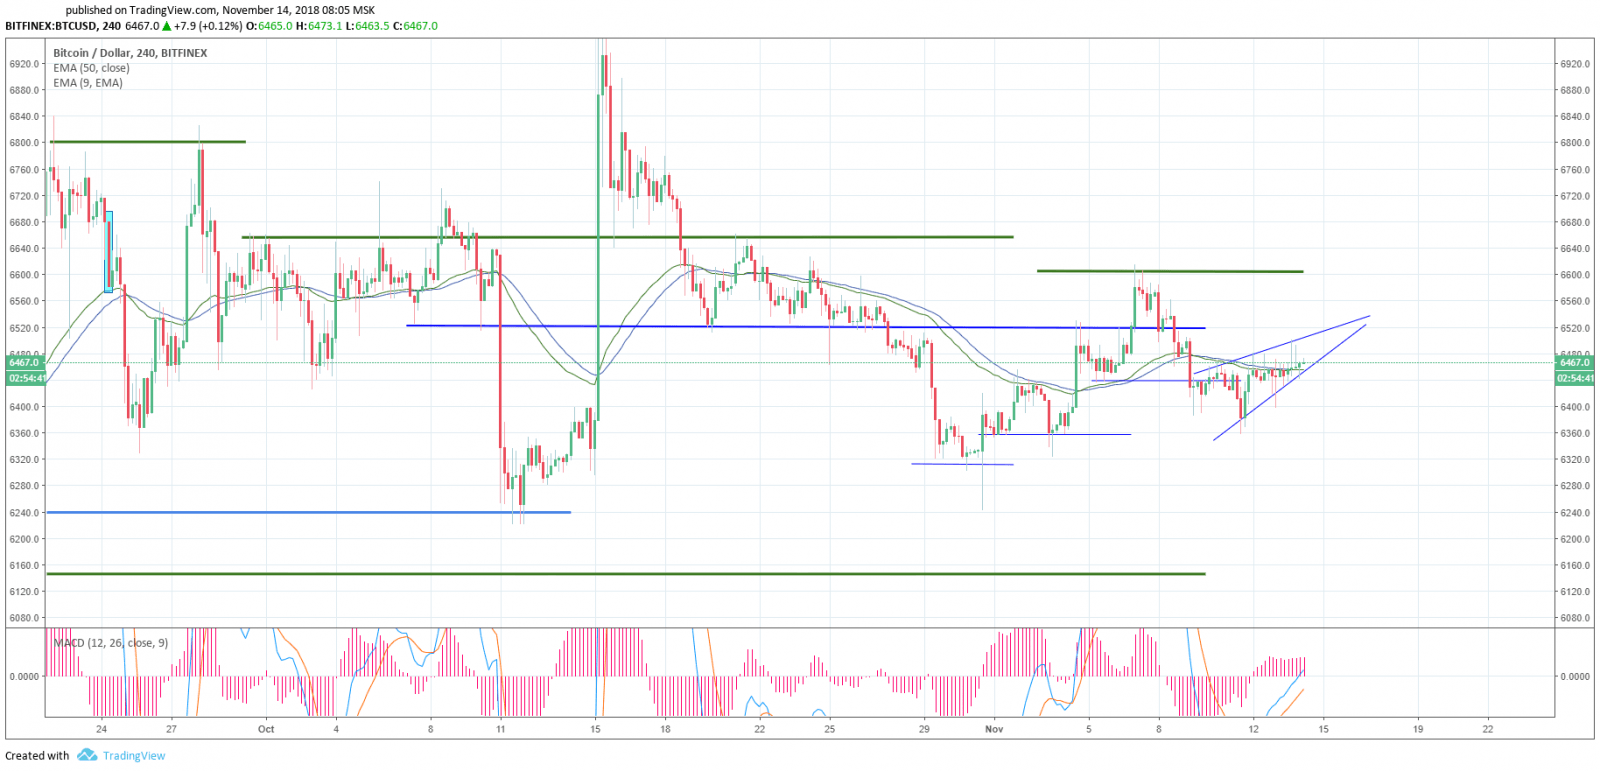
Four-hour chart
On the 4-hour timeframe, the situation is quite similar. EMA9 and EMA50 moving averages under the price, EMA50 at the level of $ 6,455. MACD indicator is confidently moving to the buy are. Upward movement holds back $ 6,500, overcoming of which will open the way to testing the levels above.
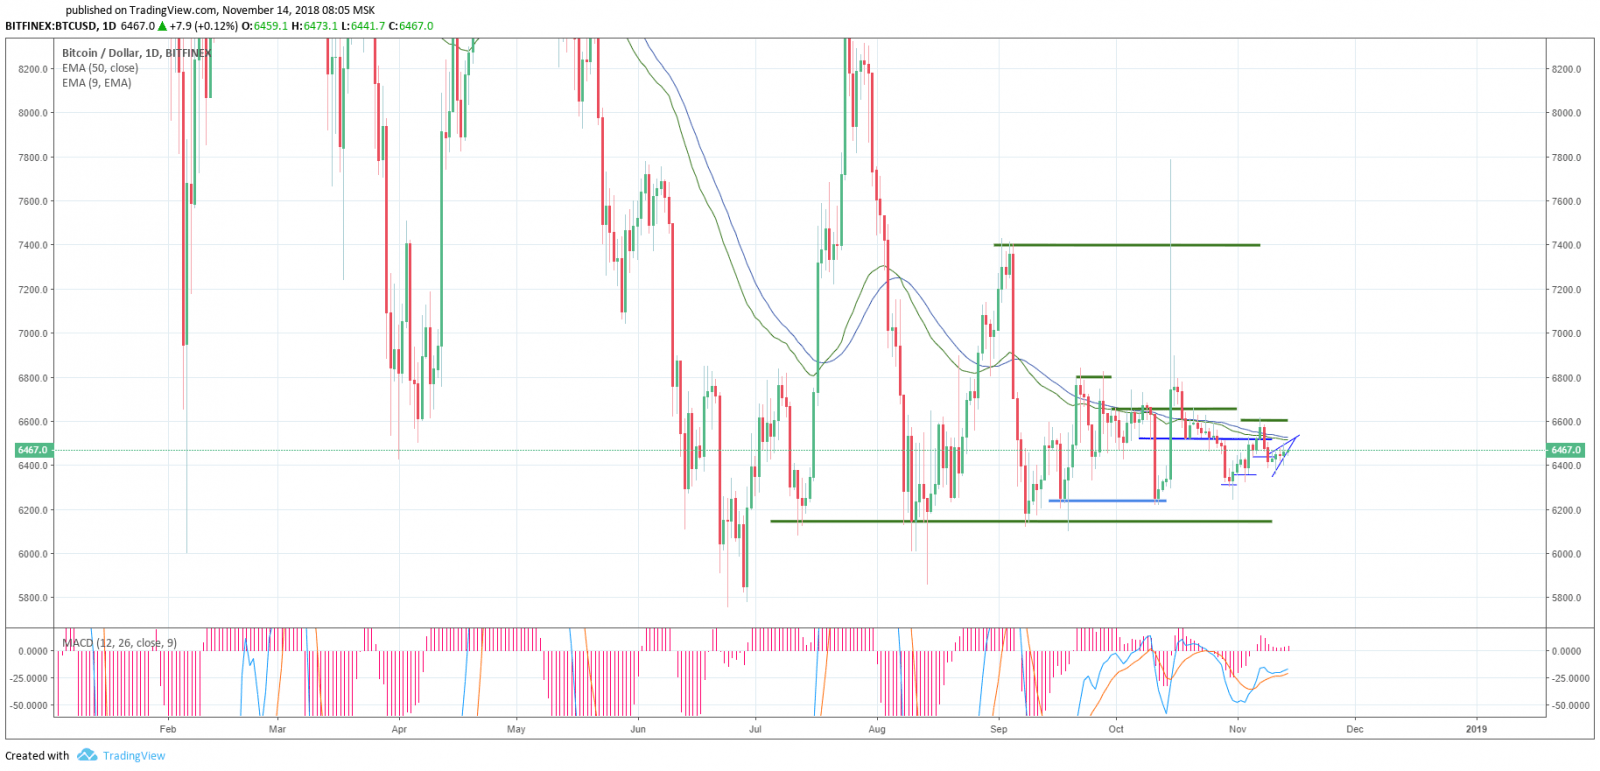
Daily chart
On the daily timeframe, significant levels of support and resistance are clearly visible. The MACD indicator is located in the trade area but shows signs of movement to the buy one. Moving averages over the price, the EMA50 will offer resistance at $ 6,515- $ 6,520.
Today (November 14) the expiration of XBT CBOE futures will take place — a phenomenon not infrequent, but it may well be the cause of market volatility. This event is worth keeping in mind anyway.
The other day (November 12) a record number of transactions were recorded in the Bitcoin network. According to data from the site blockchain.com, the volume of transactions in the network amounted to 300,000, which was a 10-month high.
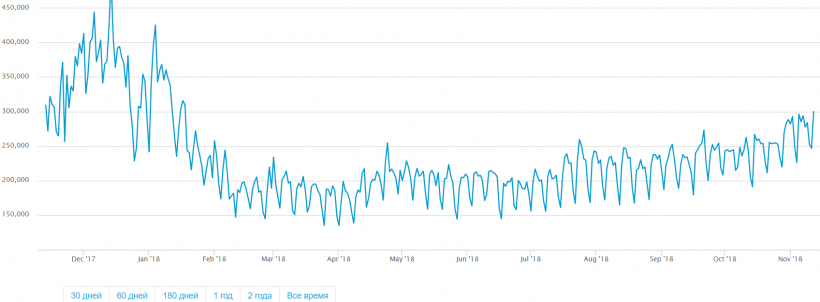
The maximum values for the entire history were recorded in December 2017, then 490,000 transactions per day were transferred to the Bitcoin network. The minimum was reached in April at around 135,129, after which a slow recovery began.
Important levels
Resistance — $ 6,500-$ 6,520, $ 6,600-$ $ 6,650, $ 6,800
Support — $ 6,440, $ 6,360, $ 6,310, $ 6,240
In general, the market is moving in the direction we need, and our strategy is fully justified.
Share this with your friends!

iFlagman


Be the first to comment
Please log in to comment