Coffee cup reading? This is the definition that perfectly describes the activities of most of our colleagues. And this is exactly what many «analysts» started doing last weekend. However, the market has not...
Coffee cup reading? This is the definition that perfectly describes the activities of most of our colleagues. And this is exactly what many «analysts» started doing last weekend. However, the market has not changed much. Now, let us stop guessing and take a look at the charts.
One-hour chart
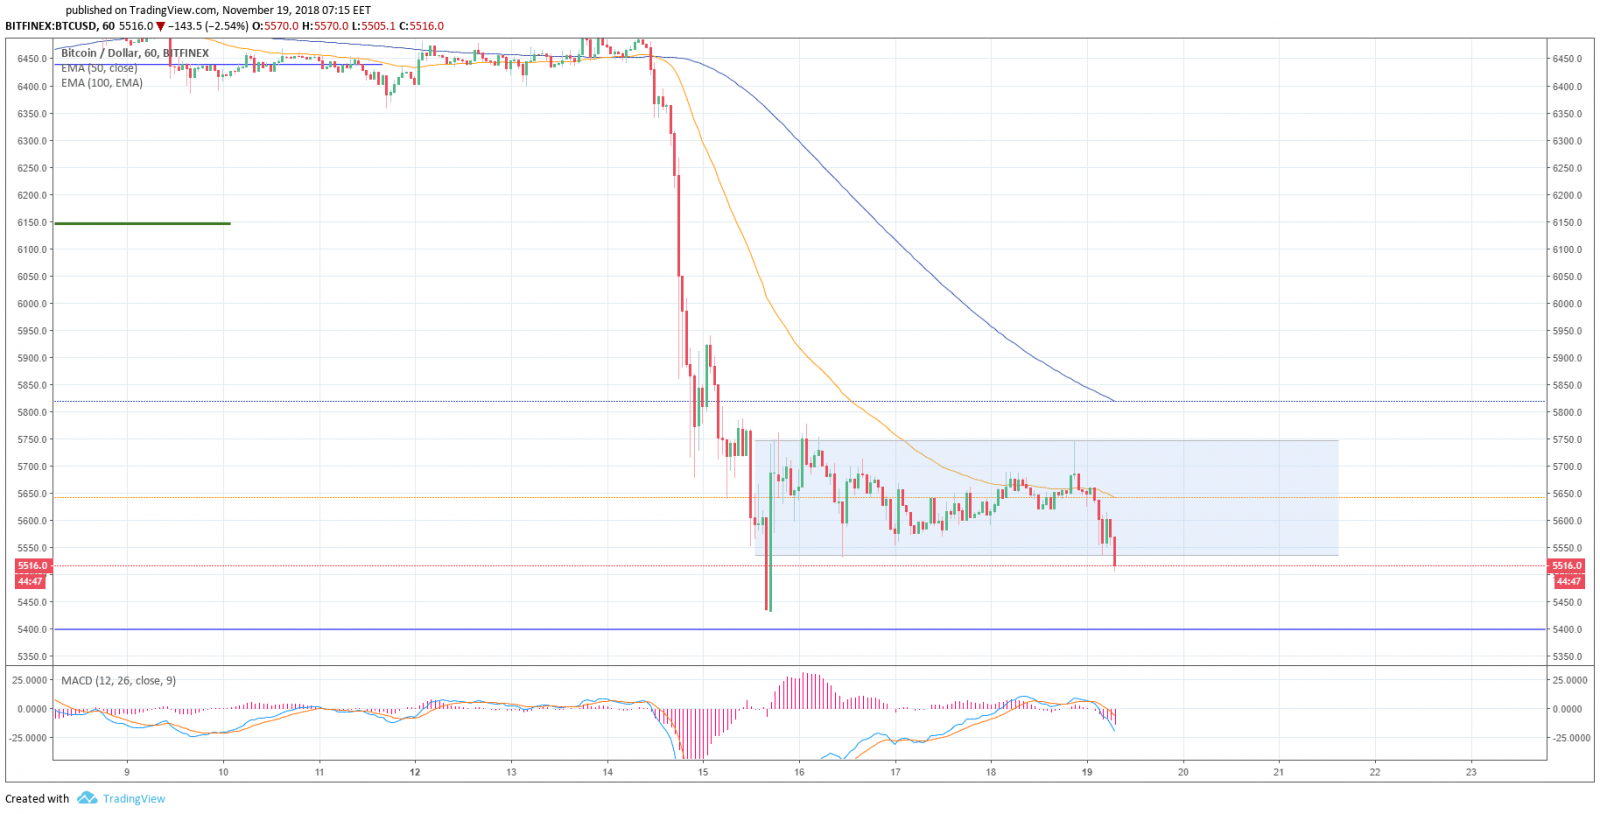
After the decline on November 15, the price is trading in a narrow corridor between $5,740 and $5,530 (see the chart). This morning there was a puncture in the corridor down to the $5,495 level, but the price quickly bounced back (it happened at the time of writing). Therefore, the support is within the $5,550-$5,490 range, and if it is overcome, the way will be opened to testing $5,400 (the level the price could not reach on November 14-15). The risk of decline is persisting.
The moving averages are above the price tending downwards, MACD indicator is within the selling area. Everything indicates a further price decrease, but a flat in the current corridor cannot be ruled out.
Four-hour chart
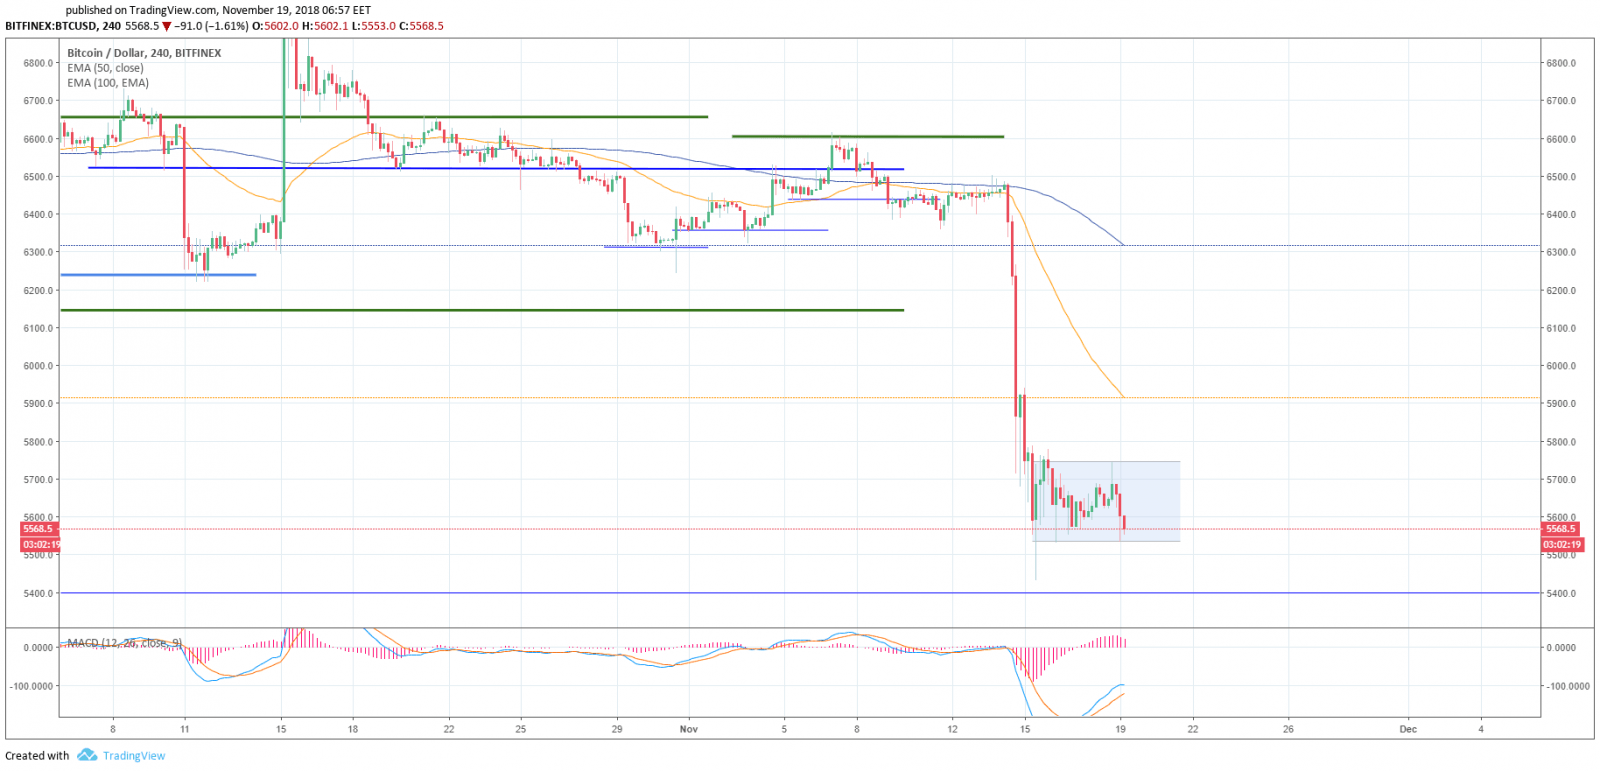
On the 4-hour chart, no reversal to an upward trade can be seen so far. The first resistance area is the $5,745 — $5,785 range.
There is a high probability of testing the $5,400 level within the next few hours. If the testing is not successfully completed on the bear side, there is a possibility of the market reversing towards growth (a lot of purchases with decreasing price). Moving averages are above the price tending downwards, MACD indicator is in the selling area.
Daily chart
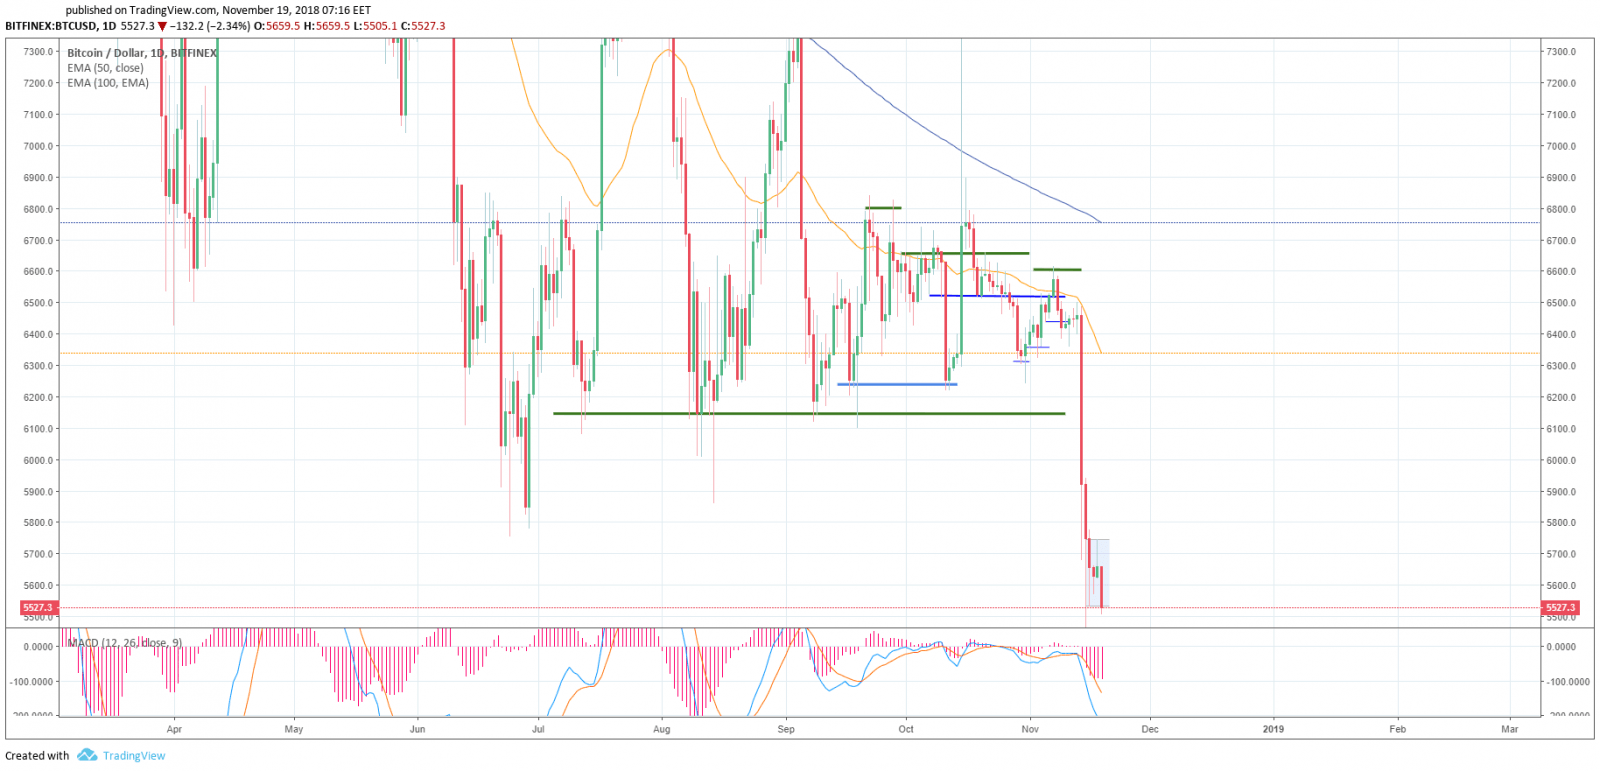
On the daily timeframe, the risks of a decline are persisting. The first target for the bears is the $5,400 level, and if it is overcome, it will open the way to the $5,100 level. We do not see any reason for the price to go down to $ 3,000, and we believe such statements are made to a greater extent for the sake of crowd pleasing to create panic in the market.
Moving averages are above the price, and MACD indicator is also in the sales area. I would like to draw your attention to the fact that after the recent decline, there was hardly any correction in the price, and it continued to trade in a narrow corridor for a few days.
Rather unexpected and pleasant news in the light of recent events came out yesterday. As early as next week, the first ETP crypto exchange offering crypto assets is to open in Europe based on a large Swiss platform. If the fight between the forks of two BCHs seems to be pushing the entire market backwards showing the inadequacy of its participants, this news from Europe gives some hope to the entire market.
The past week on the crypto market was also marked by a surge in demand for stable coins. Artem Deev, Senior Analyst at Amarkets, believes that investors have found a «safe harbour» in stable coins. Large market players switching over from bitcoin and altcoins to stable coins, has an extremely negative effect on the bitcoin price and is one of the reasons for the market collapse.
There is no need to design market entry patterns — everything depends on the trade itself. If you, like us, do not do day trading and do not chase for the prices on the charts, you can leave a few pending buy orders, where the decrease is down to $5,000.
UPD
While our proof reader was going through this text, everything written about in this report, took place in the market.
So, don’t give way to panic, just read HiTecher)
Wishing everyone a great week!
Share this with your friends!


Be the first to comment
Please log in to comment