Introduction If you are reading this article you must have already heard about stock market trading and I bet you can name two or three people who made fortunes there, for example, Warren Buffet or George...
Introduction
If you are reading this article you must have already heard about stock market trading and I bet you can name two or three people who made fortunes there, for example, Warren Buffet or George Soros.
But an ordinary person without any financial background does not quite understand how asset price movements can be predicted, so myths are created. One of them is the opinion that an exchange is a casino where only the luckiest ones win.
At first glance there are some similarities though, but stock exchange romance featured in Hollywood films is no more than a smokescreen covering a whole world and trading is a serious business that requires an equally serious approach.
Speculations on exchanges are the subject of a thousand studies by economists, mathematicians, statisticians and even programmers (lately). It is impossible to explain this store of knowledge in a single article that is why we will just touch upon the principles that underpin quotation predictions.
Fundamental analysis
The oldest method of price analysis is the fundamental one; it works best on long time intervals and is a powerful tool in the hands of patient investors. FA aims to carefully evaluate the economic and financial indicators of a company whose securities we want to trade. Financial statements, the accounting balance and reports by rating agencies are the long-term capitalist’s best friends.
Factor analysis
Sometimes factor analysis is segregated as a sub-type of fundamental analysis. This fancy concept describes a fairly simple mechanism — monitoring of the news background and trading depending on the type of news. It the news is positive, it is essential to find an additional signal to buy. If the news is negative — there should be an extra signal to sell. So, factor analysis, unlike the fundamental one is more situation-dependent.
Technical analysis
More popular today among traders, technical analysis greatly differs from fundamental one and is used for short- or medium-term trading.
The position is usually held for a few seconds (!) to a few weeks but not months as is often the case in fundamental analysis. TA comprises a whole range of practices that may differ a great deal but have one common feature — a buy/sell decision is taken based on the price performance in the past. That is technical analysis involves reading the chart. It is not by chance that at the time of birth TA adepts were called chartists.
Graph analysis
Graph analysis involves a search for certain graph models trading decisions will be based on. Among the key models are:
- Trends — extended price movements on which trend lines and trading channels are drawn.
- Flats — trading channels within which the price varies. The upper border of the flat is called the resistance level and the lower one is the support level.
- Various triangles and other figures, for example the «head and shoulders» or a «double bottom».
Wave analysis
The author of the wave analysis is the financier Ralph Elliot who viewed the market as low and high sea tides where every action creates and opposite reaction. In other words, all price movements fall into two main groups of waves:
- Impulses move the price either up or down;
- Corrections are waves that offset impulses. Corrections move against the previous movement.
Candlestick patterns of price action
There are two main ways to draw a chart — with Japanese candlesticks and bars. Each candlestick or bar shows the price action within a certain time frame, for example, 15 minutes, an hour or a day and has four features:
- Open (opening candlestick) — the asset price at the beginning of the time frame.
- Close (closing candlestick) — the asset price at the end of the time frame.
- High — the asset maximum price within the given timeframe.
- Low — the asset minimum price within the timeframe.
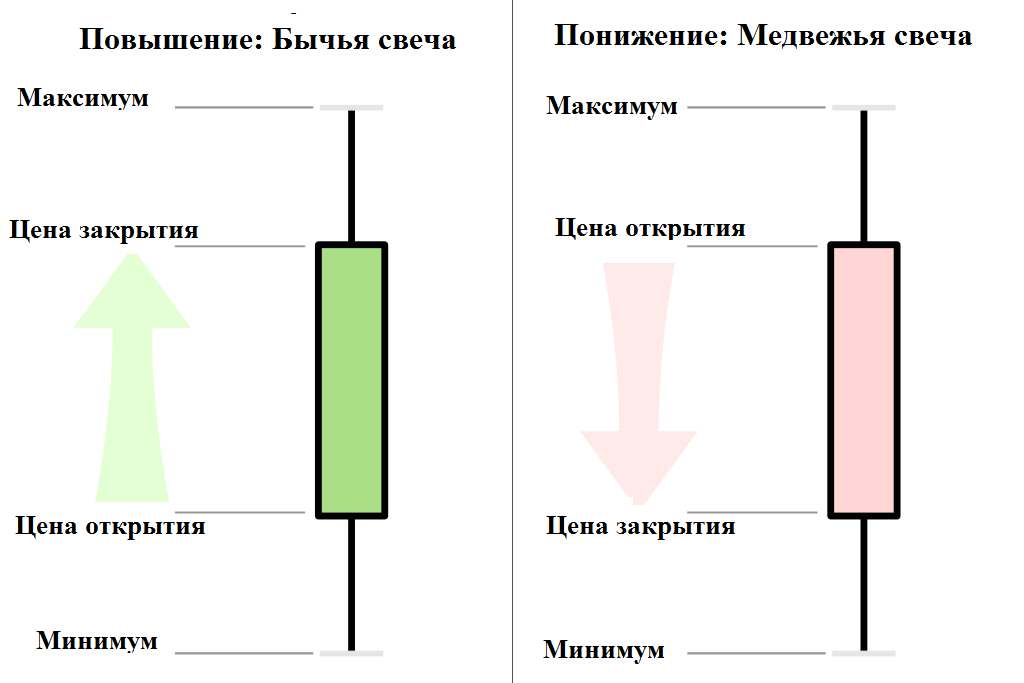
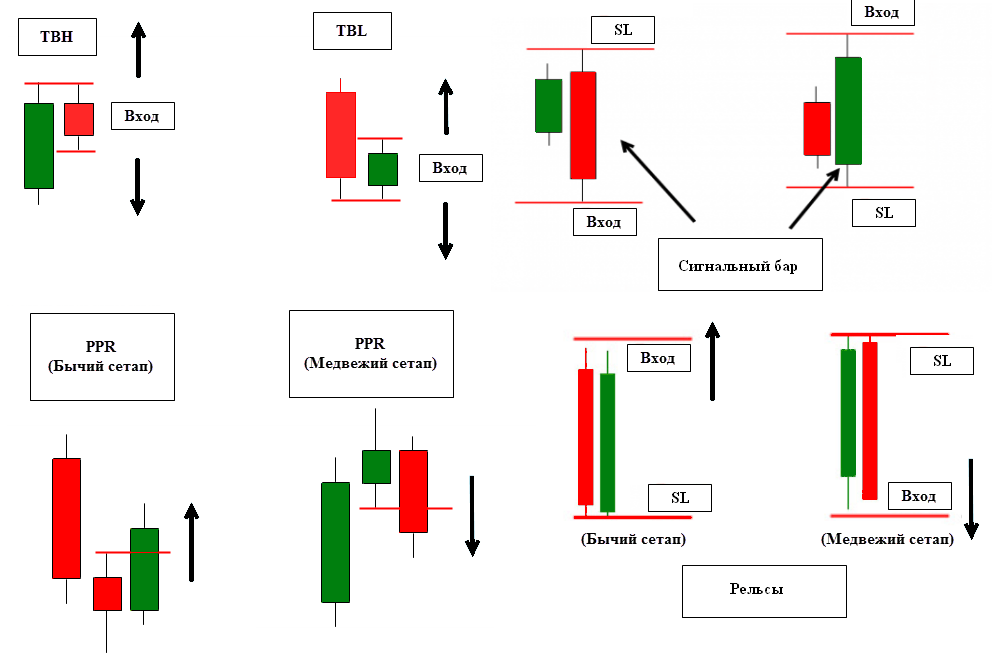
A transaction decision may also be taken based on the candles’ appearance and their combinations. Bearish patterns are called signals to sell, while bullish ones — to buy.
Volume analysis
Trading volume means the number of executed transactions and it may be of two types — vertical and horizontal. The vertical volume shows the number of transactions executed within a particular time frame while the horizontal one indicates the price level of such transactions.
The horizontal volume helps draw conclusions on the importance of the support and resistance levels — the higher their volumes, the more likely is the price rebound. The vertical volume indicates to what extent one can rely on any particular pattern. Volume analysis coupled with the price action can be any trader’s excellent companion.
Indicators
An indicator is a special function that involves complex mathematical calculations and data processing aimed to provide unique trading signals for a particular financial asset. Indicators may be conventionally broken down into two big categories:
- Trend indicators monitor market trends. A slide median curve with its many varieties is the most popular one among traders. Indicators based on it enable to monitor a trend, see its beginning and end, especially when several functions are combined with a number of settings. Other popular indicators include parabolic curves, alligators, ichimoku, fractals, Bollinger bands and others. They are additional lines drawn over the chart.
- Oscillators. They work very well in the market that has no clear-cut trend and are used to determine the trading band. In such cases trading continues within certain ranges. Oscillators are opened in a separate range and look like a number of curves. The most popular one is the stochastic oscillator and the relative strength index.
Trading robots
As programming advances, trading robots — software that executes transactions without human participation — has lately become very popular in the market. The user needs only to write a code and enter a certain mechanism in his «assistant» according to which it will operate. Saving trader time is trading robots’ advantage and their disadvantage is the steep price.
Moreover, as time goes by, robots become obsolete and stop brining profits. If you do not monitor such software, it may lose your money without you even noticing it. Fortunately, modern robots have a loss-making transaction limit after which trading is discontinued.
In conclusion
Understandably, the classification this article offers is rather tentative and the technical analysis methods are not limited to the ones described here. Moreover, none of prediction methods is used individually and professional traders, seeking to find the Holy Grail, combine them all the time.
There is no ‘right’ trading strategy of making money in the financial markets. Trading means working with probabilities. The market changes all the time and even the most time-tested system sometimes malfunctions.
That’s why anyone who wants to trade on exchanges should be able to keep his balance and execute transactions with utmost discretion. «Think before you act» — this folk wisdom could be a pretty good motto for every exchange speculator, I believe.
Share this with your friends!

iFlagman


Be the first to comment
Please log in to comment