
The miracle hasn’t happened after all. Toby Weiss predicted the Bitcoin price at $100,000 by the end of 2018 and Tom Lee talked about the price at $25,000... But let’s get back to reality. No one is on a hurry...
The miracle hasn’t happened after all. Toby Weiss predicted the Bitcoin price at $100,000 by the end of 2018 and Tom Lee talked about the price at $25,000... But let’s get back to reality. No one is on a hurry to buy and the attempts to reach the height of $3,800 stopped on 9 December from which level BITCOIN has been gradually declining.
The price is, currently, in the sideways channel and its gravitation to the lower boundary may indicate a continued decline. On the 1- hour timeframe, the moving averages are above the price and looking down. EMA50 is at the $3,485 level near the channel’s upper boundary and is acting as a local resistance.
The next resistance on EMA 100 will be at the $3,578 level. The MACD indicator is in the sell area but showing signs of a reversal. The support at $3,400 level (the lower boundary of the sideways channel) is still keeping a decline in check.

4-hour chart
On the four-hour timeframe, the moving averages are also above the price and the MACD indicator is in the sell zone. It should be noted that the whole week trading has been sluggish. For an ascending movement, the price should reach the level above $3,500 and consolidate above it; the next growth target is $3,642 — EMA50. Support at the $3,400 level is keeping a decline in check.
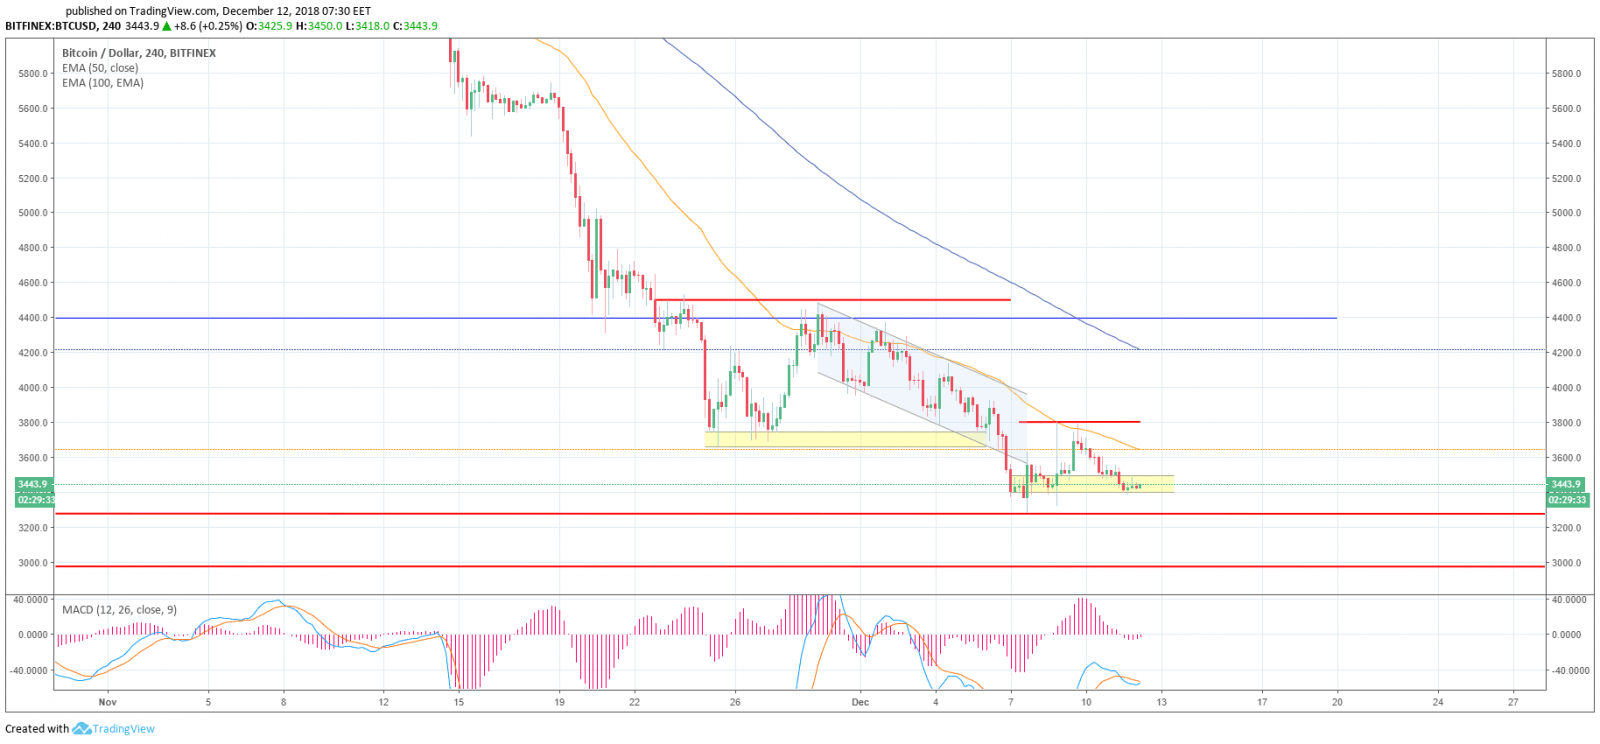
The day timeframe also indicates that the decline continues, but so far the attempts to go below $3,400 have been accompanied by purchases preventing the price from going down. Risk to dip below the all-year minimum remains. The moving averages are above the price and looking down; the MACD indicator is in the sell zone.

Interestingly, the 14-week Relative Strength Index (RSI) fell below 30.00 yesterday. According to CoinDesk analyst Omkar Godbole, such a large oversell indicates the exhaustion of bears. Other analysts also confirm that after the RSI falls below 30.00, an upward correction starts to emerge.
Support levels on the 1-hour chart:
- $3,400 (this week’s low is $3,381)
- $3,300 (this year’s low is $3,277)
If they are overcome the price may go down to the $3,000 level.
Resistance at the $3,800 level will pave the way to the $4,000 level and a further test in the $4,350 -$4,500 area
Among recommendations: it is better to stay out of the market and not open new deals.
Share this with your friends!

iFlagman


Be the first to comment
Please log in to comment