
Winter is.. tomorrow =) Nobody is eager to sell, and that’s good! (On the other hand, nobody is in a hurry to buy either.) On Wednesday, after the publication of our review, the Bitcoin price overcame...
Winter is.. tomorrow =)
Nobody is eager to sell, and that’s good! (On the other hand, nobody is in a hurry to buy either.)
On Wednesday, after the publication of our review, the Bitcoin price overcame resistance at the $4,200 level and tested the $4,400 level several times. At the moment, the price is moving in the upwards channel and is locally squeezed between the $4,400 and $4,200 levels. The moving averages are below the price. ЕМА50 has crossed ЕМА100 upwards signaling continued growth. MACD indicator is getting “unloaded”, but it is still within the buying area. The key level for further growth is $4,400. If it is successfully overcome, the road to levels $4,500 – $4,700 levels and further to $5,000 will be opened. However, a decrease in volatility and lengthy trading at the lower boundary of the current upwards channel may end up in a breakthrough downwards and support testing at the $4,200 level. So, it’s too early yet to relax.

Four-hour chart
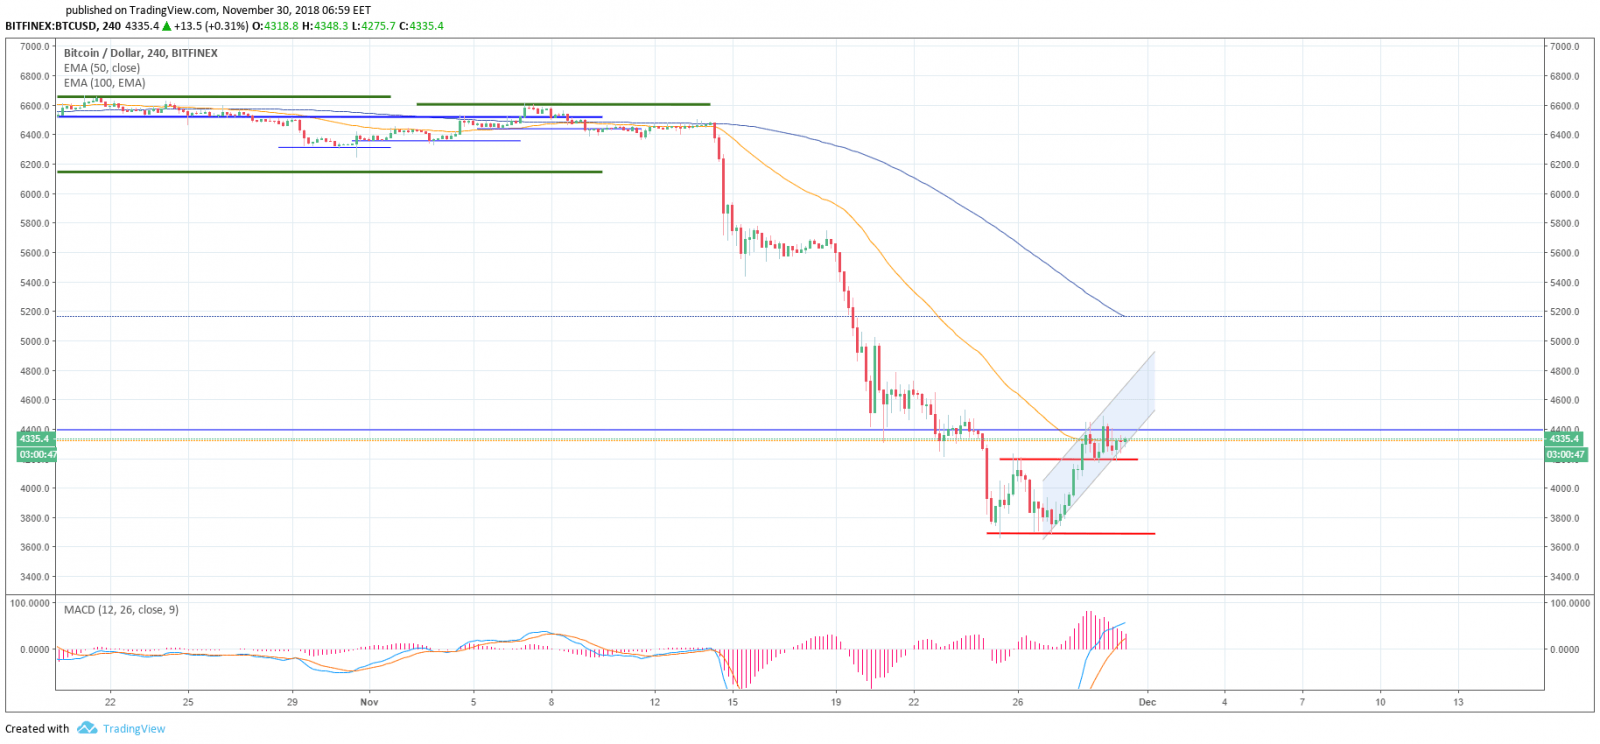
An upwards channel is clearly seen on the 4-hour timeframe. The chart also clearly shows “a double bottom” pattern representing a reversal pattern which can potentially signal the beginning of an ascending trend. To resume upwards movement, the price needs to overcome resistance at the $4,400 level. As of this writing, ЕМА50 is at the $4,335 level, i.e. at the current price level. ЕМА100 is at $5,163 and will curb the growth. MACD indicator is moving into the buying area signaling upwards movement. Support is at the $4,200 level.
Daily chart
With the growth on November 28, the price broke through the trend line (local descending trend that started on November 14) towards growth. At the moment, the upwards channel has not yet picked up steam, and there is a probability of its expansion. MACD indicator is in the selling area turning upwards. The moving averages are above the price.

Reasons for reduced volatility
Today is Friday plus it is the last day of the month. These are the two factors in the market prompting many market participants to fix their positions. On the whole, it is a standard situation.
Today is also the expiry date of CME Group futures, which is not a new event either, but it can potentially push the price in either direction making many market participants wait it out staying outside the market.
As to our advice for today: this Friday and the weekend to follow are not the best time for quick trading. A transaction at the top can be opened from the channel boundary (+/-5%) and with a decrease to support levels: $4,240–4,150, $4,000 and $3,750.
But remember to take into account the likely decline in the first days of the month.
Such decline is normal however, and the general mood in the market suggests that the panic attack has been stopped. The capitalization is gradually increasing (as of this writing, it totals $139,247,091,755), and the pattern on the 4-hour timeframe can actually trigger an ascending trend (P.S. However, you should not hope that the price will skyrocket tomorrow =)).
Wishing you all profits and a great weekend!!!
Share this with your friends!

iFlagman


Be the first to comment
Please log in to comment