
Readers who followed our previous recommendations managed to earn on the BTC growth. And this makes us very happy! Since the writing of the article, the BTC price has worked out the «inverted head and...
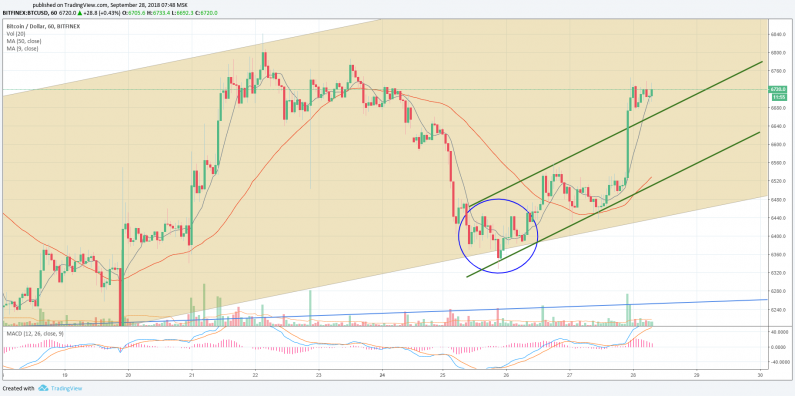
Readers who followed our previous recommendations managed to earn on the BTC growth. And this makes us very happy! Since the writing of the article, the BTC price has worked out the «inverted head and shoulders» figure (blue circle on the hourly chart) and continued to move strictly in the channel which we designated (marked green on the chart). Thus, the pair took the first target we designated at the level of $ 6600. If you followed our recommendations, then — congratulations!
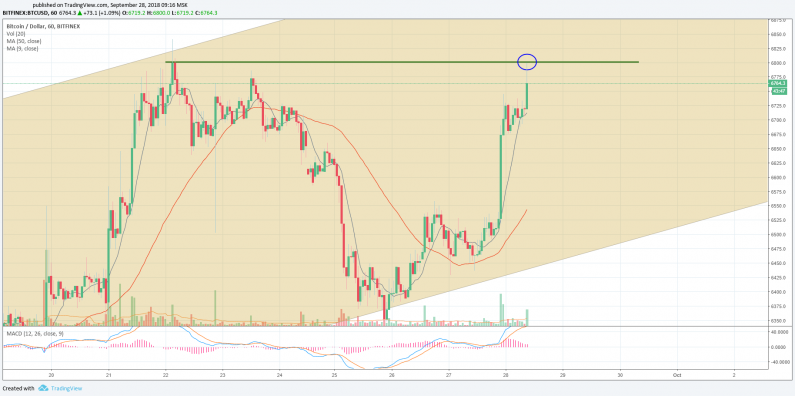
Yesterday, at the close of the day, the price broke through this channel, reaching the level of $ 6745. Now it is consolidating in a narrow range of 6680 $ - 6740 $, making attempts to pierce the level of 6800 $. The fast moving average (MA9) "looks" up and is above the price, the slow moving average (MA50) also "looks" upwards and will support at $ 6520 in case of a decline.
Does everything speak of an upward movement?
At 4-hour timeframe, the price moves in the ascending channel and is at its upper border. We entered the range of direct trading and as close as possible to the important resistance level of 6800 $, overcoming which opens the way to the levels of 6900 $ and the psychologically important mark of $ 7400 with possible consolidation in the range of $ 7000 - $ 7100.
The fast moving average (MA9) tends to cross the slow one (MA50), signalling the continuation of the upward movement, the MACD indicator also indicates an upward movement.
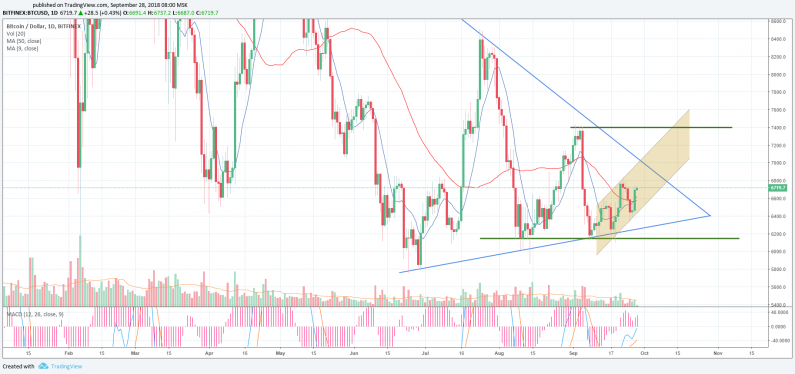
On the daytime timeframe, everything speaks of an upward movement, and there is no panic of the past days. The price moves in the ascending channel and this week it worked out 100%: from September 23 to September 27, it moved from the top to the bottom to start moving upwards. That's why we advise you to trade by purpose.
What do the indicators tell?
The fast moving average (MA9) crossed the slow (MA50) from the bottom up, indicating an upward movement. MACD also aspires to the buying area.
The decrease in volatility as a harbinger of rapid growth?
Analysts noted that the Bitcoin's volatility had reached its minimum values for 21 months. So, for a day from 26.09 till 27.09 the rate decreased by 0.02%, and for the last three months, it grew by only 5%. The last time a similar situation occurred in 2016 and followed by a strong growth rate. The pattern works not only for the cryptocurrencies: in traditional markets, the long absence of the manifested trend leads to the start of a new upward or downward trend.
The Bollinger Bandwidth (the distance between the Bollinger Bands, divided to a 20-day moving average line) fell to a 21-month low. The indicator shows that last 9 months the volatility is rapidly declining. At large, the picture that looms on the Bitcoin graph indicates a rapid sharp movement soon. Together with all the crypto-enthusiasts, we will hope that there will be a jump in the direction of growth.
At the time of writing, the capitalization is $ 223,888,713,334. We expect the results of future closing, which will take place today, on September 28, at the CME Chicago Mercantile Exchange.
Summing up
The pair BTC / USD moves according to our forecasts, which allowed our readers several times to take a profit along the whole wave length, starting from the level of 6100 $.
Now our goals remain the same, and the first of them is the level of $ 6,800, the attempt to overcome it started yesterday. Do remember that the price is still trapped in the triangle (blue on the daily timeframe), only after overcoming it we can start talking about the autumn rally (which will happen earlier than the level of $ 7400).
Do not give in to the euphoria of successful trades, always remember that the market does not tolerate emotions and punishes very dearly for it.
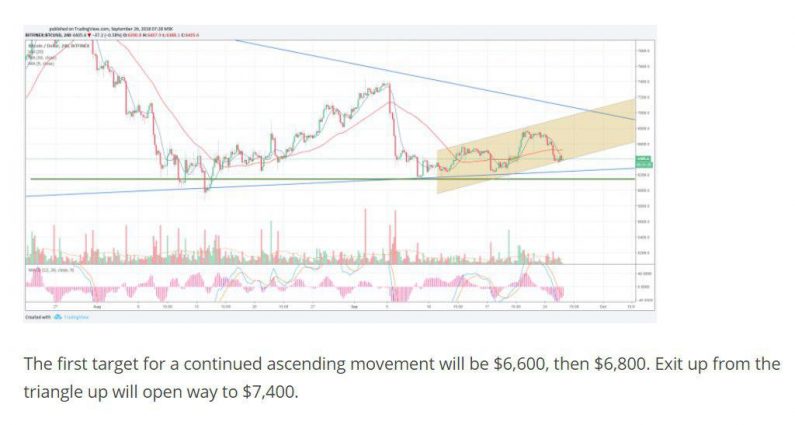
Support levels in case of a decline persist from the previous review ("The first goal for continuing the upward movement will be $ 6,600, followed by $ 6,800. Exit from the triangle upwards opens the way to $ 7400"). Besides, the support level is also added at $ 6550 (MA50), in the area where you can open a buy order.
Share this with your friends!

iFlagman


Earlene
I could not refrain from commenting. Exceptionally well written! It’s appropriate time to make some plans for the long run and it is time to be happy. I have read this publish and if I could I want to counsel you few fascinating things or suggestions. Perhaps you could write subsequent articles referring to this article. I wish to learn more things about it! Everyone loves what you guys are up too. This kind of clever work and reporting! Keep up the awesome works guys I've included you guys to my own blogroll.
188bet
Great items from you, man. I have take into account your stuff previous to and you're simply too magnificent. I really like what you have obtained here, certainly like what you are stating and the best way through which you say it. You are making it entertaining and you continue to take care of to stay it smart. I can't wait to learn far more from you. This is actually a great site.