
BTC / USD continues sideways movement, and the situation is still uncertain. Let’s consider different timeframes. Hourly timeframe On the daily timeframe, the price is clamped in a narrow range of $ 6,580 —...
BTC / USD continues sideways movement, and the situation is still uncertain. Let’s consider different timeframes.
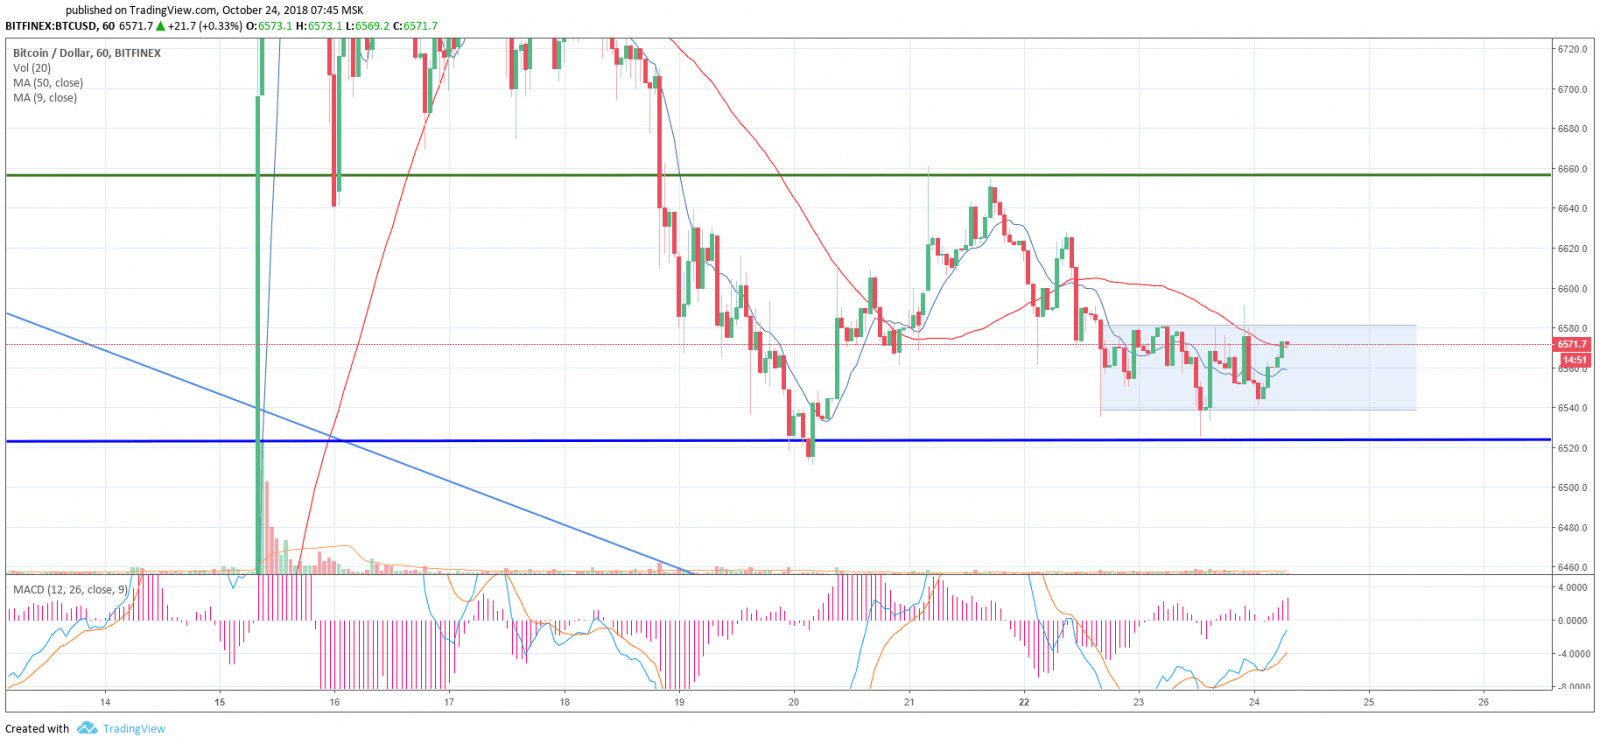
Hourly timeframe
On the daily timeframe, the price is clamped in a narrow range of $ 6,580 — $ 6,540. Sliding averages do not indicate either growth or decline — however, they move in parallel, MACD tends to the buy area. The graph clearly indicates the movement channel as well as strong levels of resistance and support.
UPD: at the time of this review writing, the price is out of its range.
4-hour timeframe
Everything is a bit more interesting here since the «double bottom» reversal figure arises from yesterday. In case of successful figure working out, we can see the price increase to the first resistance of $ 6,650. So far, the price of growth can hold back the level of $ 6,640, formed by the sliding average MA50, which is still higher than the price. MACD indicators are moving steadily in the buy area — there are all the conditions for an upward movement.
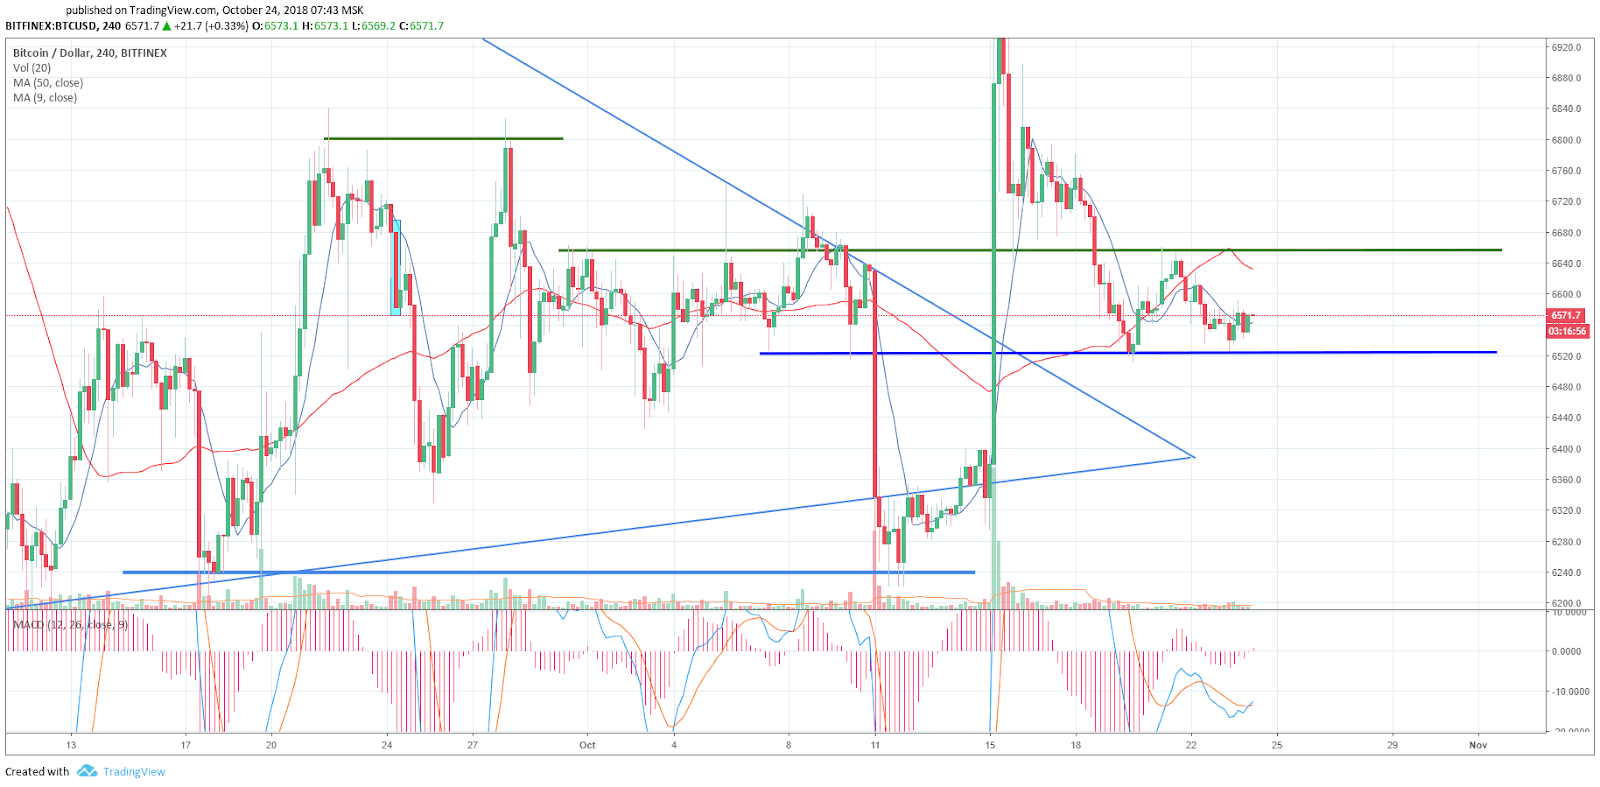 UPD: At the time of writing the review, on the 4-hour chart, the price of one candlestick almost completed the «Double bottom» reversal figure. Resistance levels are the same.
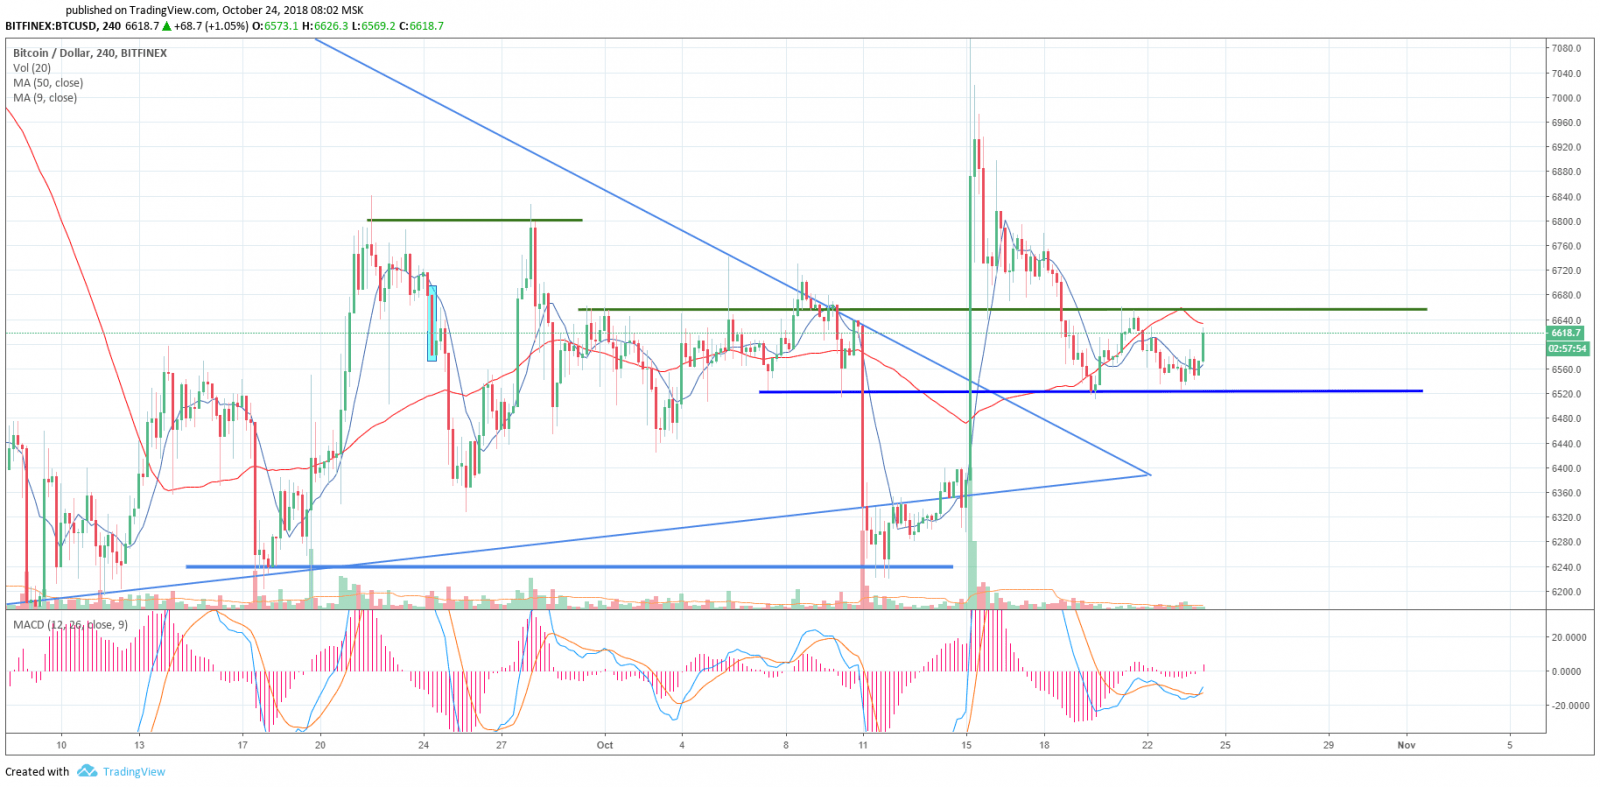 On the daily timeframe, you can see for yourself how volatile the Bitcoin can be and how it is trading right now. MACD indicator in the neutral area. The MA50 sliding average is lower than the price and forms support at $ 6,530, which coincides with the blue line on the chart.
Bullish news?
The CME futures contracts end on October 26. This event often leads to high volatility.

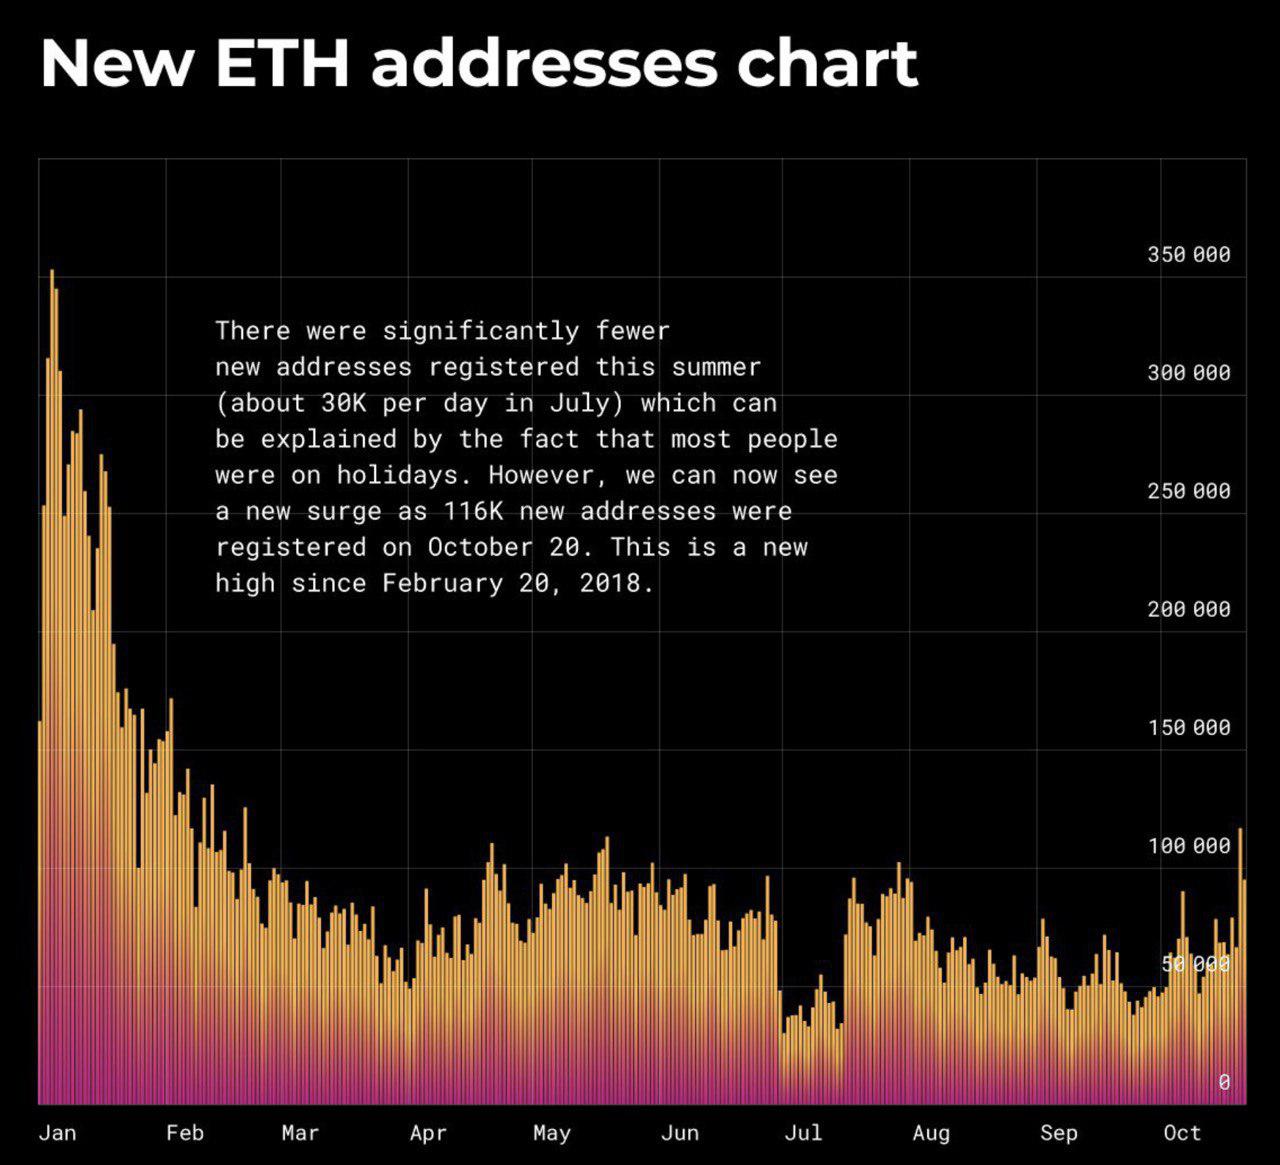
By the way, despite the marked decline in interest to the crypto world and the fact that Ethereum is now experiencing particular difficulties, an essential indicator of the new wallets registration is growing. In October, there a peak of 116K was reached, and this is the highest indicator since February 20, 2018.
Another bullish news is that the CBOE exchange inside sources say that Bitcoin ETF approval is inevitable. According to the SEC, the VanEck, SolidX, CBOE companies solved all the issues, and it is only a matter of time before the new asset class is approved.
Let’s sum up
Drawing a reversal figure on a reasonably strong timeframe is a definitely positive signal for growth. At the same time, the price is still trading in a limited range and, if resistance does not break down at $ 6,650, the upward movement from the «double bottom» figure may not end in result, and the price will continue to fall sideways with likely testing of the lower level of the current range. Profit to everyone!
Share this with your friends!

iFlagman


Be the first to comment
Please log in to comment