
Consolidation on the chart continues, and the more noise pops up on the profile resources and chats, the more likely is the opposite price movement. Nothing has changed since our last review, but let's take a...
Consolidation on the chart continues, and the more noise pops up on the profile resources and chats, the more likely is the opposite price movement.
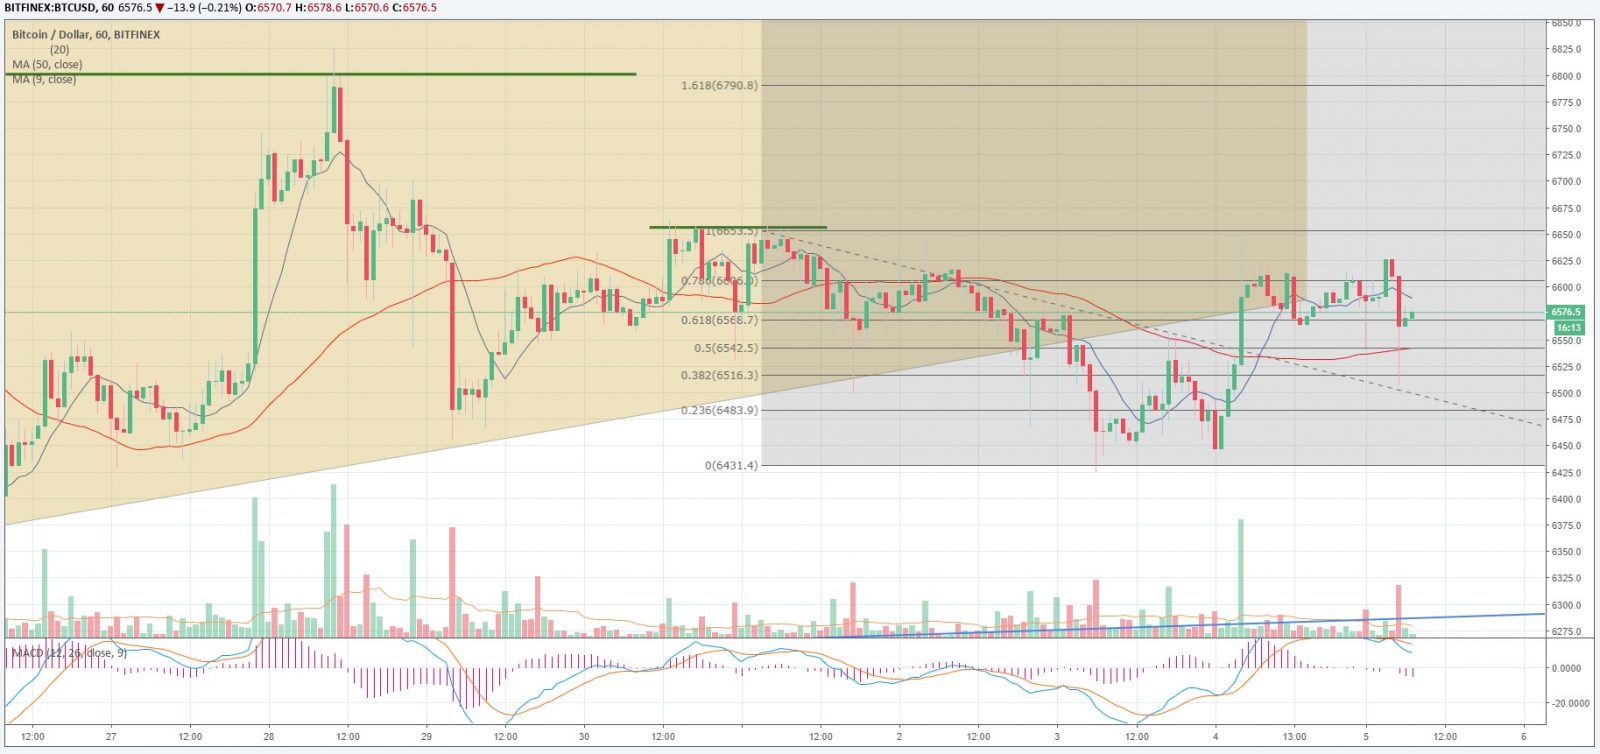
Nothing has changed since our last review, but let's take a look at the charts.Let's start with the hourly chart first. All the conspiracy theories fans and those convinced ib the failure of technical analysis are recommended to look at the BTC / USD price movement on the hourly timeframe. Since the last decline and increase, the price has come up against the Fibo level of 0.786, which the bulls have repeatedly tried to overcome. The support level is the Fibo level of 0.618 (golden ratio).
The price is between two moving averages at the moment. Fast MA9 is above the price. Slow MA50 passes through the level of $ 6540, thus forming a strong support level that completely coincides with Fibo level of 0.5. Also worth noting is the presence of downward breakdowns, which can be either the stops removal of stops or the usual “testing one’s nerves”. Observations show that after them the price quickly returns to its current range.
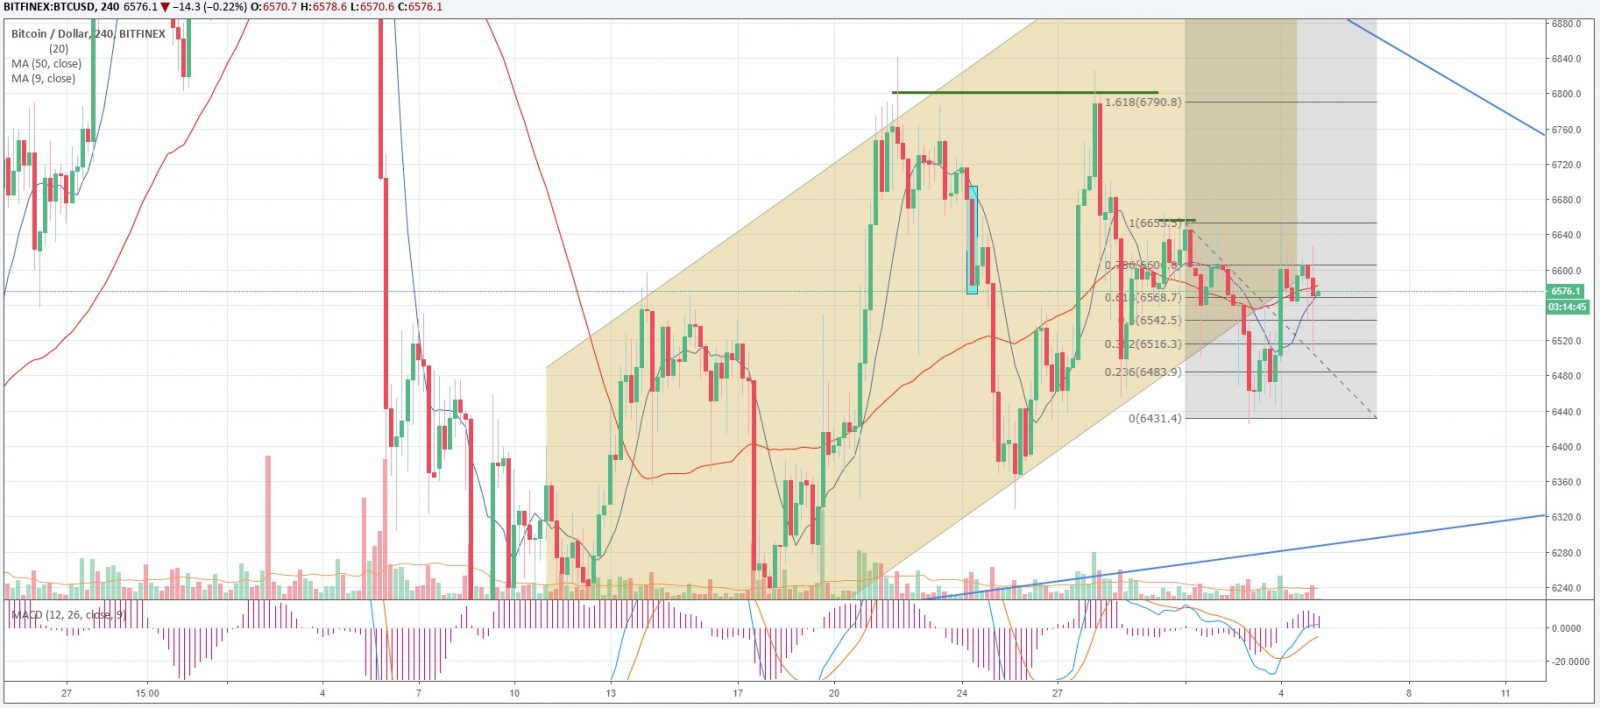
However, the price movements on Fibonacci levels on a 4-hour timeframe is even more noticeable. The fast moving average (MA9) tends to cross the slow (MA50) from the bottom up, thereby showing a buy signal. The first resistance on the way up will be $ 6600; there have already been attempts to consolidate above it. In case of a decline, the first support passes at the level of $ 6550-$ 6660. The levels of $ 6500 - $ 6450 follow after.
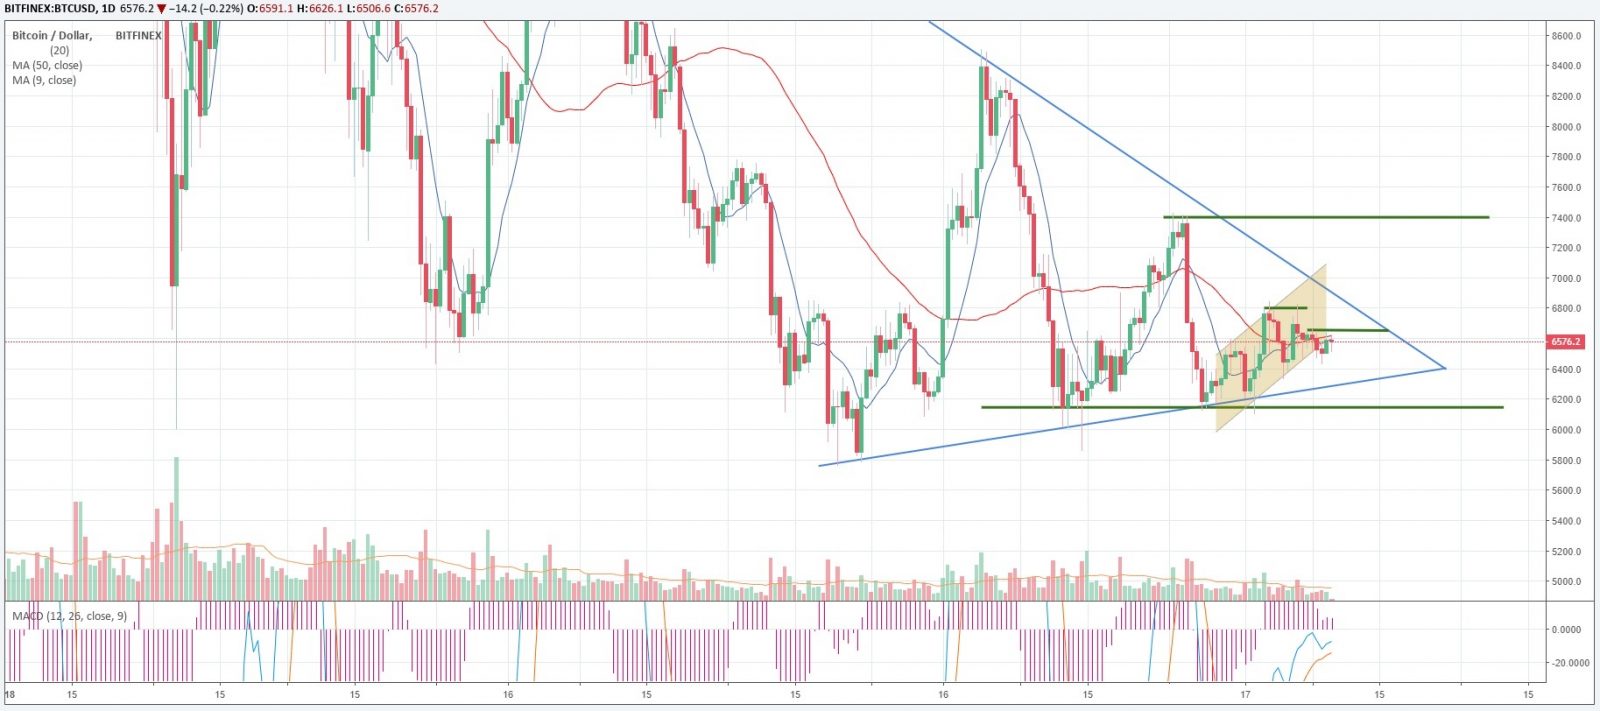
On the daily timeframe, we clearly see how close the denouement is. The price of BTC / USD comes close to the triangle borders and is currently in the middle between them, which adds sharpness to an already tense market. We have shown the primary levels of support and resistance on the chart. Moving averages tend upwards. Fast MA9 is trying to cross the slow MA50 from the bottom up, indicating a possible upward movement. The MACD indicator is also trying to enter the buy zone.
So let's summarize. The overall picture has not changed since our last review. Significant levels of resistance and support remained the same. Even though emotions prevail in the market at large, readers can be sure that our forecasts are written from the position of common sense, as evidenced by the results of our latests reviews.
Have a great weekend everyone!
Share this with your friends!

iFlagman


Be the first to comment
Please log in to comment