
It is the penultimate week of the year! Haven’t you noticed it? Well, let’s look at the charts. While everybody was shouting about the soaring prices at the end of last week, our review warned that the risk...
It is the penultimate week of the year! Haven’t you noticed it? Well, let’s look at the charts.
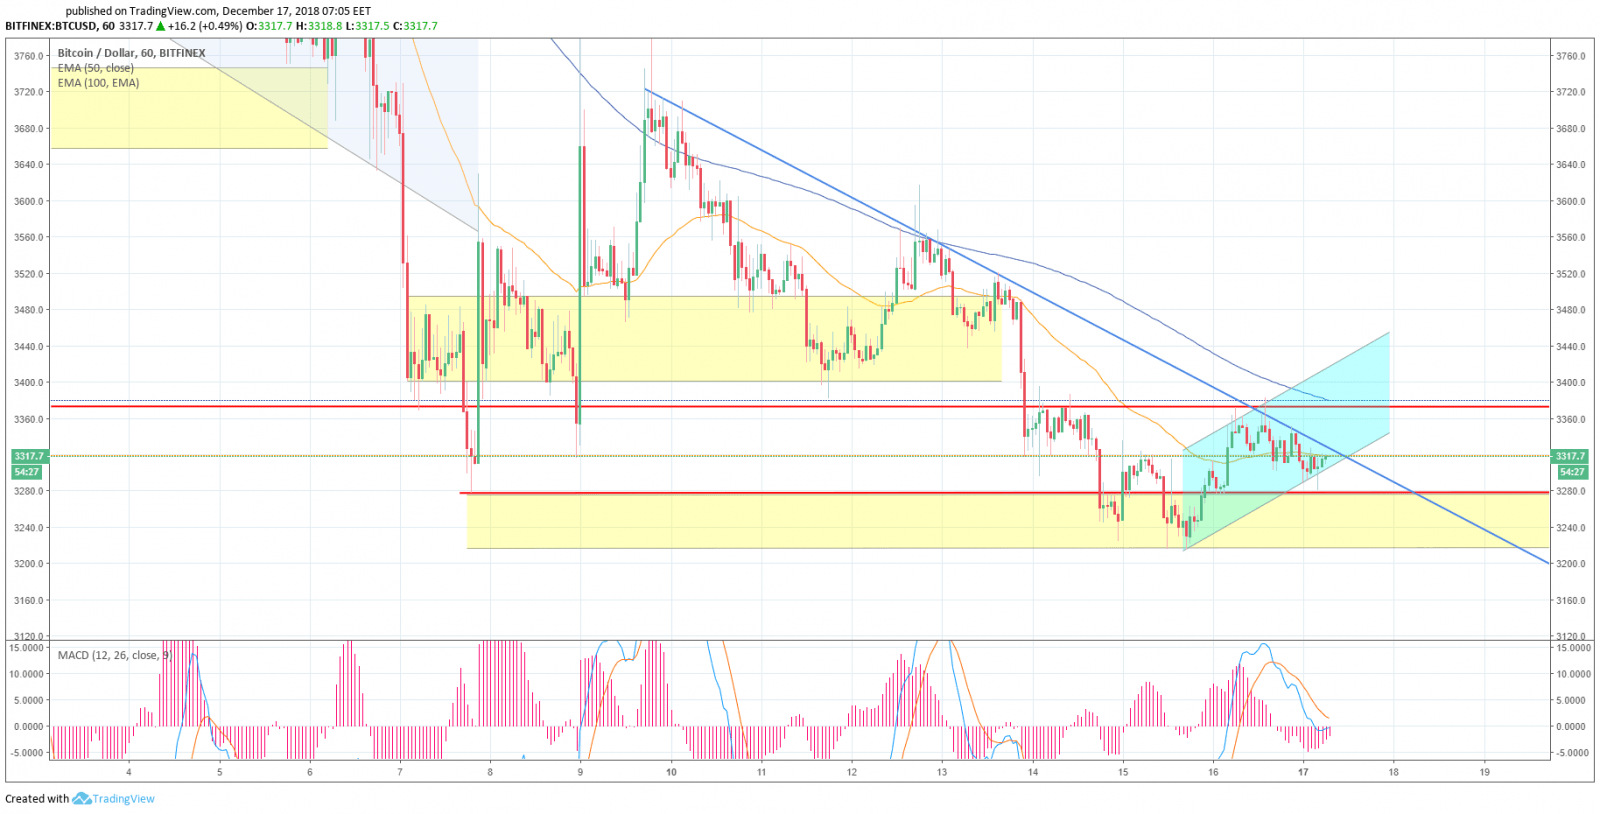
While everybody was shouting about the soaring prices at the end of last week, our review warned that the risk of a decline and sinking to a new yearly low still remained and was highly probable. And it did happen. BITCOIN price crashed to a new yearly low reaching $3,215. As of this writing, the price is pressing upwards in the local ascending channel and got literally caught up on EMA50 at $3,319. Further resistance will be EMA100 level at $3,380 almost matching our resistance line drawn early last week ($3,370).
To generate a strong buy signal, EMA50 needs to cross EMA100 from the bottom up (which looks more than realistic now), the risk of decline is still there, all the more so, as the price is moving at the lower channel boundary.
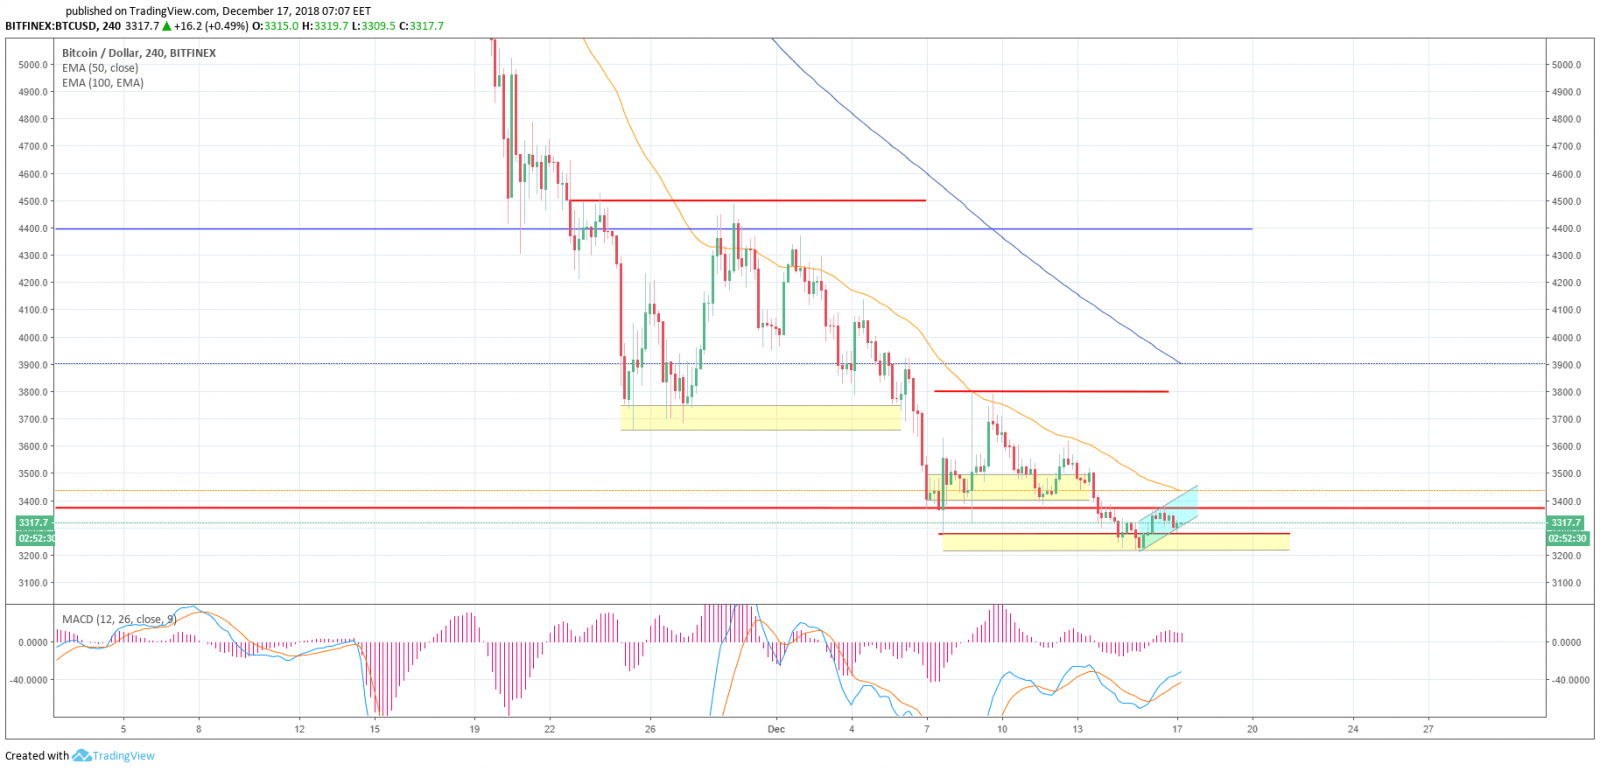
Four-hour chart
Everything on the 4-hour timeframe suggests further decline. MACD indicator is «looking up», while moving averages ЕМА50 and ЕМА100 pass above the price «looking down». The bulls are trying to raise the price pushing it up in the ascending channel. It is still a long way to go to the $3,370 resistance level, while the support at the $3,280 level and at the channel boundary may give way any time soon.
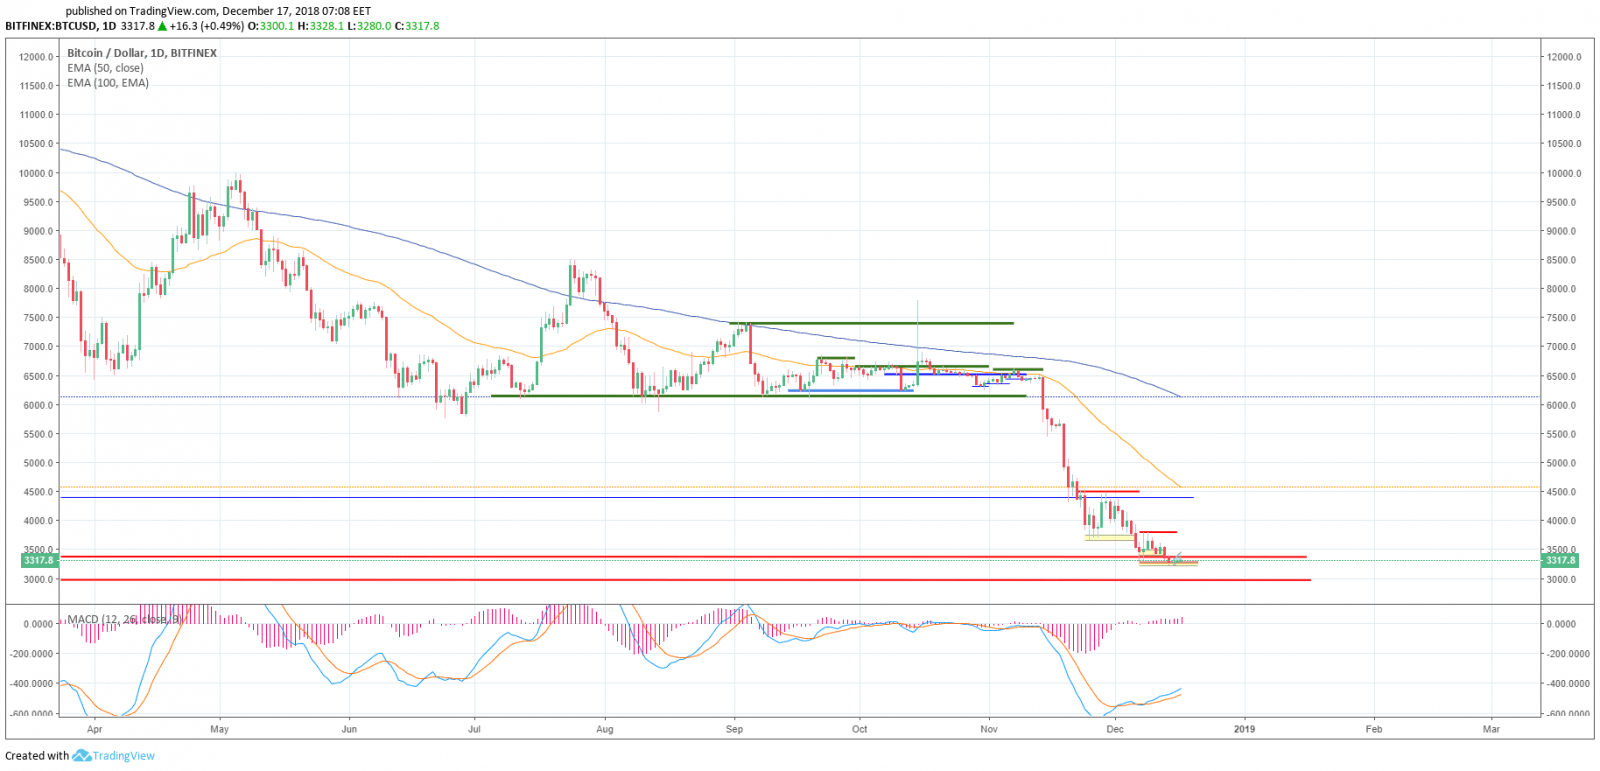
Daily timeframe
The good news, however, is that the bears do not have as much strength as everybody thinks. The sinking to the new low was from $3,277 to $3,215, which is reflected on the daily chart as a very short candle, and the bears do not appear to have enough strength to reach $3,000 (the level with a large number of buy orders). In any case, we need to monitor the market closely now. We are likely to see growth signals within the next few days, of which we will immediately inform you.
The daily trading volume is reducing with the cryptocurrency price decline. Over the past week, it fell by 29% — from $14 billion to $10 billion. In fact, many people believe that Bitcoin has already reached its bottom. Weiss Ratings analysts’ advice is to start investing in BTC. It seems it is being followed: LocalBitcoin trading volume has reached the figures of the end of 2017. Russia is among the leaders in trading volumes along with Venezuela and Argentina.
On the whole, experts are quite positive. For example, Eric Erwin of Blockforce Capital believes that this year’s correction will have no effect whatsoever on cryptocurrency market prospects.
Moreover, some experts noticed that Bitcoin had been oversold for the first time since January 2015 on the weekly chart. In their opinion, it may indicate that the bears are losing their strength. However, the price hit its next 2018 low after that, while ETF, the Swiss analogue of Bitcoin, rose thrice to new highs in trading volumes.
Important levels
For the descending movement the support is at $3,277, $3215 levels (yearly low).
The ascending movement will be constrained by $3,370, $3,400, $3,480—$3,500 levels.
In fact, the bears might not have enough momentum to push the prices further down, which may be the first prerequisites for the long-awaited upwards movement.
Share this with your friends!

iFlagman


Be the first to comment
Please log in to comment